Why ?
How it works ?

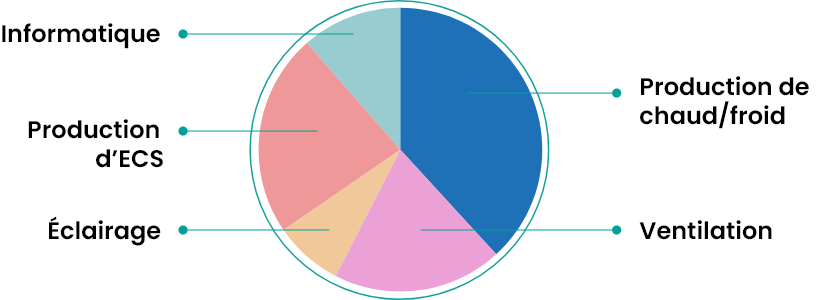
It allows you to follow your consumption automatically by use, areas, type of equipments…
For the heating
For the cooling
for the lighting
for DHW production
for ventilation systems
And displays them on the building’s consumption monitoring dashboard


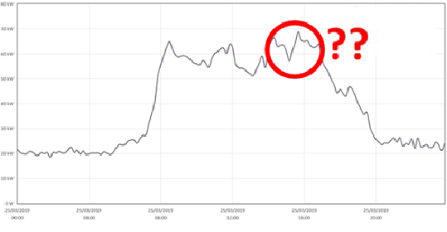
Load curve


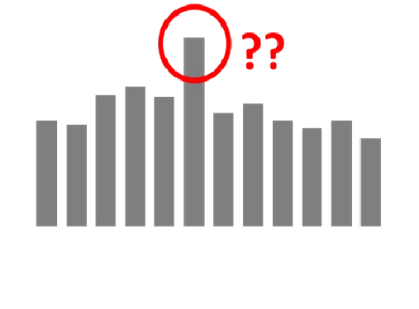
Monthly consumption
A tool to visualize your consumption by use

To recap
Follow
your consumption changes
Certify
your installation
Detect
unusual events
Assess
the gains made
Manage
your energy performance


